Back to Tea Page (お茶のページに戻る)
Tea Consumption (茶の消費量)
|
|
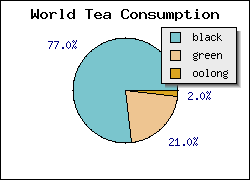
Per capita mean consumption of tea in the world is 120 mL/day [1], the second most consumed beverage in the world, next to water. Black tea is principally consumed in Western countries, green tea is popular in Asia, and oolong tea in China and Taiwan[2].
|
世界における茶の一人当たり消費量は 120 ml/日 [1]で、水に次いで世界で飲まれる飲料ナンバー2です。紅茶は主に西洋で飲まれ、緑茶はアジア、ウーロン茶は中国と台湾で飲まれます[2]。
|
|
|
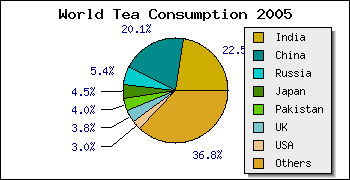
| World tea consumption (1000 tons)
|
| location |
1996-2000 |
2001 |
2002 |
2003 |
2004 |
2005
|
| world |
2833 |
2985 |
3093 |
3199 |
3227 |
3362
|
| India |
635 |
671 |
693 |
714 |
735 |
757
|
| China |
482 |
496 |
538 |
555 |
604 |
675
|
| Russia |
146 |
156 |
166 |
167 |
169 |
180
|
| Japan |
138 |
149 |
135 |
138 |
156 |
150
|
| Pakistan |
109 |
107 |
99 |
118 |
120 |
134
|
| UK |
142 |
137 |
134 |
119 |
129 |
128
|
| USA |
91 |
97 |
94 |
94 |
100 |
100
|
| Source: FAO 2006. Current market situation and medium term outlook. [3]
|
|
Tea producing countries have big potential to increase their per capita consumption.
Per capita annual consumption of tea in India, China, Kenya in 2005 were only
0.69, 0.52, 0.40 kg, whereas Russia and UK consumed 1.26 and 2.20 kg, respectively, per capita.
|
|
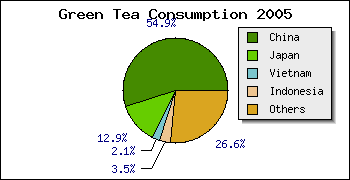
| Green tea consumption (1000 tons)
|
| location |
2000 |
2001 |
2002 |
2003 |
2004 |
2005
|
| world |
681 |
782 |
784 |
756 |
832 |
884
|
| Mainland China |
343 |
350 |
376 |
388 |
418 |
485
|
| Japan |
109 |
107 |
94 |
101 |
116 |
114
|
| Vietnam |
16 |
16 |
18 |
17 |
17 |
19
|
| Indonesia |
30 |
33 |
34 |
37 |
37 |
31
|
| Source: Annual bulletin of statistics 2006 (International Tea Committee)
[3]
|
|
|
|
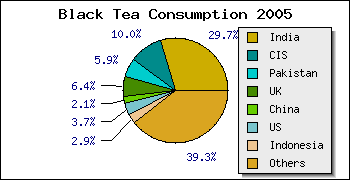
| Black tea consumption (1000 tons)
|
| location |
2000 |
2001 |
2002 |
2003 |
2004 |
2005
|
| world |
2214 |
2224 |
2233 |
2280 |
2368 |
2342
|
| India |
617 |
668 |
635 |
684 |
693 |
695
|
| CIS[4] |
206 |
202 |
220 |
223 |
229 |
234
|
| Pakistan |
109 |
105 |
96 |
116 |
119 |
138
|
| United Kingdom |
134 |
162 |
164 |
154 |
153 |
151
|
| China (mainland) |
37 |
25 |
41 |
28 |
44 |
49
|
| United States |
81 |
87 |
84 |
82 |
88 |
86
|
| Indonesia |
33 |
57 |
57 |
48 |
56 |
68
|
| Source: Annual bulletin of statistics 2006 (International Tea Committee)
[3]
|
|
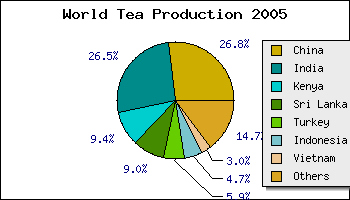
Tea Production (茶の生産量)
|
| World tea production (1000 tons)
|
| location |
2001 |
2002 |
2003 |
2004 |
2005
|
| world |
3046 |
3174 |
3249 |
3388 |
3504
|
| China |
722 |
766 |
791 |
856 |
940
|
| India |
856 |
883 |
907 |
893 |
928
|
| Kenya |
295 |
287 |
294 |
325 |
329
|
| Sri Lanka |
296 |
311 |
303 |
308 |
317
|
| Turkey |
143 |
150 |
155 |
206 |
206
|
| Indonesia |
173 |
173 |
168 |
170 |
166
|
| Vietnam |
82 |
93 |
95 |
97 |
104
|
| Source: FAO 2006. Current market situation and medium term outlook [3]
|
|
Links, References
- Tea consumption ranking in the world (in Japanese)
- Tea comsumption in Japan (in Japanese)
- ↑ 1.0 1.1 McKay DL, Blumberg JB (2002) "The role of tea in human health: An update" J Am Coll Nutr 21:1-13
- ↑ 2.0 2.1 Wu CD, Wei GX (2002) "Tea as a functional food for oral health" Nutrition 18(5):443-444
- ↑ 3.0 3.1 3.2 3.3 Ho CT, Lin JK, Shahidi F (Eds.) (2009) Tea and Tea Products Nutraceutical Science and Technology 8 CRC Press
- ↑ The Commonwealth of Independent States
Back to Tea Page (お茶のページに戻る)